 Normally, when the subject of California is brought up, one will
most likely think of sandy beaches, palm trees, and surfing. When it's
in the context of sports one may think of such enterprises as the L.A.
Dodgers, San Francisco Giants and 49ers and especially in recent years,
the Golden State Warriors. The icy, colder, more obscure entity of the
sport of hockey would be one of the last things to cross someone's mind
when thinking of California. Hockey and California have never been
synonymous ideas, which is a shame because hockey is being played at an
extremely high-caliber level throughout the state right now. The
competition in California in the NHL has been incredible going back a
decade and has just gotten better in the last 5 years. This is something
that needs to be recognized and celebrated. The San Jose Sharks, Los
Angeles Kings, and Anaheim Ducks are all franchises that have
experienced great success for the past decade and deserve to be in any
conversation about what's great about California. For those who are not
familiar with these franchises, let's take a look at each one and their
successes in the past five to ten years.
Normally, when the subject of California is brought up, one will
most likely think of sandy beaches, palm trees, and surfing. When it's
in the context of sports one may think of such enterprises as the L.A.
Dodgers, San Francisco Giants and 49ers and especially in recent years,
the Golden State Warriors. The icy, colder, more obscure entity of the
sport of hockey would be one of the last things to cross someone's mind
when thinking of California. Hockey and California have never been
synonymous ideas, which is a shame because hockey is being played at an
extremely high-caliber level throughout the state right now. The
competition in California in the NHL has been incredible going back a
decade and has just gotten better in the last 5 years. This is something
that needs to be recognized and celebrated. The San Jose Sharks, Los
Angeles Kings, and Anaheim Ducks are all franchises that have
experienced great success for the past decade and deserve to be in any
conversation about what's great about California. For those who are not
familiar with these franchises, let's take a look at each one and their
successes in the past five to ten years.
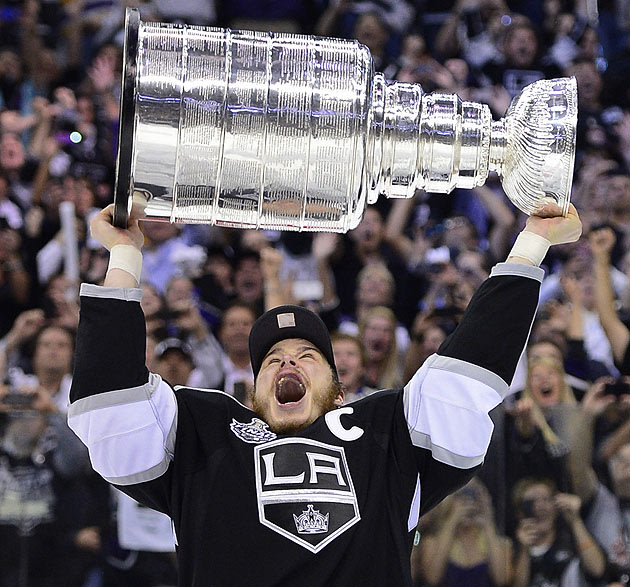
Los Angeles Kings
The
Kings have a .552 points percentage for the last ten years, but have
been at .600 in the past five. They may not be as high in the points
percentage rankings as the other California teams but especially in the
past 5 seasons, they've made the best of their playoff opportunities
lifting two Stanley Cups over their heads in 2012 and 2014.
Elite NHL players such as centers, Anze Kopitar and Jeff Carter,
goalie, Jonathan Quick, and defenseman Drew Doughty have contributed to
most of this recent success acting as the core of this franchise. They
have all accomplished so much in their careers and are still young
enough to carry this franchise into the near future. Jeff Carter is the
oldest of the core at 31, but has been one of the major leaders in the
clubhouse since coming over from the Columbus Blue Jackets in 2011,
taking some of that weight off of the beleaguered Dustin Brown's
shoulders. Anze Kopitar and Jonathan Quick along with Dustin Brown have
been lifelong Kings, which will always garner bonus points with fans
when weighing one's whole career. Anze has been one of the most
consistent, skilled, and scrappy centers in the game while Quick can
transform in to a brick wall at times. Team captain, Dustin Brown has
contributed greatly as well but has tapered off overall in the past few
seasons.
The
Kings are at an apex right now. The beginning of the 10 year sample
size is more or less pedestrian hence why their overall points
percentage in those 10 seasons aren't as impressive as the other two
California teams, but they make up for it by trumping them in the
Stanley Cup title department. They climb the rankings in the 5 year
sample size, which is proof that they are only getting better. All in
all, this Kings team and franchise has a lot to be proud about in the
recent past and present and should be deemed as the best sports
franchise in the L.A. area as this blog is being published.
Anaheim Ducks
 The
Anaheim Ducks can be held in the same conversation as the L.A. Kings
depending on if you count the Orange County team part of the L.A. or its
separate entity within a greater L.A. area. They would still only hold
onto a small portion of the sports scene pie like the Kings do and are
even more overlooked than the Kings. Dropping the "Mighty" from their
moniker was the beginning to an attempt to steer people away from
associating them with the popular Might Ducks movie franchise, so that
they can build a true NHL franchise identity. They sure are doing
everything they can to assure that with their play on the ice. Their
points percentage for the last 10 seasons is .614 beginning the decade
size sample with winning a Stanley Cup in the 2006-2007 season, the
first year of just being the "Ducks." The Ducks are only improving with a
.630 points percentage in the past 5 seasons!
The
franchise has had a lot of talent skate for them in the recent past
including hall of famer, Scott Niedermayer and potential future hall of
famer Teemu Selanne, but the true catalysts of this franchise in the
past ten seasons have been the inseparable duo of Ryan Getzlaf and Corry
Perry. These two forwards have really evolved together. Both,
individually,are very capable of controlling the ice but work off of
each other extremely well whether or not they're on the same line
together. They've been the main cogs in what's been a sensational 10
year run where the franchise has only been omitted from the playoffs
twice and have won the division each of the last four years. Other key
pieces include the likes of pesky center, Andrew Cogliano, up and coming
winger, Rickard Rakell, and rookie stud goalie, John Gibson.
There's
a perfect mix of veteran presence and maturing, talented youth to keep
the Ducks towards the top of the division for years to come. Anaheim is,
by far, more than Disneyland and an orange orchard-laden past. There's
a NHL hockey team that also calls Anaheim home and is deserved of
national attention.
San Jose Sharks
 For
NHL fans, especially their own fans, the Sharks epitomize that team
that always does so well in the regular season, but just cannot figure
out the playoffs as a Stanley Cup Championship has eluded them. With
that being said, the Sharks should still be recognized as one of the
best franchises in the past 10 years. Looking at their track record for
the past 10 seasons alone is rather eye-opening. In the past ten
seasons, the Sharks have never finished under .500. Their totals for
the past decade sum up to a .637 points percentage. That's the best
points percentage among the three California teams in the past ten
seasons and second among all teams in the league behind the Pittsburgh
Penguins. Their .600 points percentage over the past 5 years isn't too
shabby either. Other than the '14-'15 season, the Sharks have made the
playoffs every year since '06-'07. That consistency of success is
incredibly hard to achieve in this current, free agency era. Of course
it doesn't happen without consistently great players and the Sharks have
definitely had their fair share of consistently great players to grace
the ice in San Jose.
For
NHL fans, especially their own fans, the Sharks epitomize that team
that always does so well in the regular season, but just cannot figure
out the playoffs as a Stanley Cup Championship has eluded them. With
that being said, the Sharks should still be recognized as one of the
best franchises in the past 10 years. Looking at their track record for
the past 10 seasons alone is rather eye-opening. In the past ten
seasons, the Sharks have never finished under .500. Their totals for
the past decade sum up to a .637 points percentage. That's the best
points percentage among the three California teams in the past ten
seasons and second among all teams in the league behind the Pittsburgh
Penguins. Their .600 points percentage over the past 5 years isn't too
shabby either. Other than the '14-'15 season, the Sharks have made the
playoffs every year since '06-'07. That consistency of success is
incredibly hard to achieve in this current, free agency era. Of course
it doesn't happen without consistently great players and the Sharks have
definitely had their fair share of consistently great players to grace
the ice in San Jose. 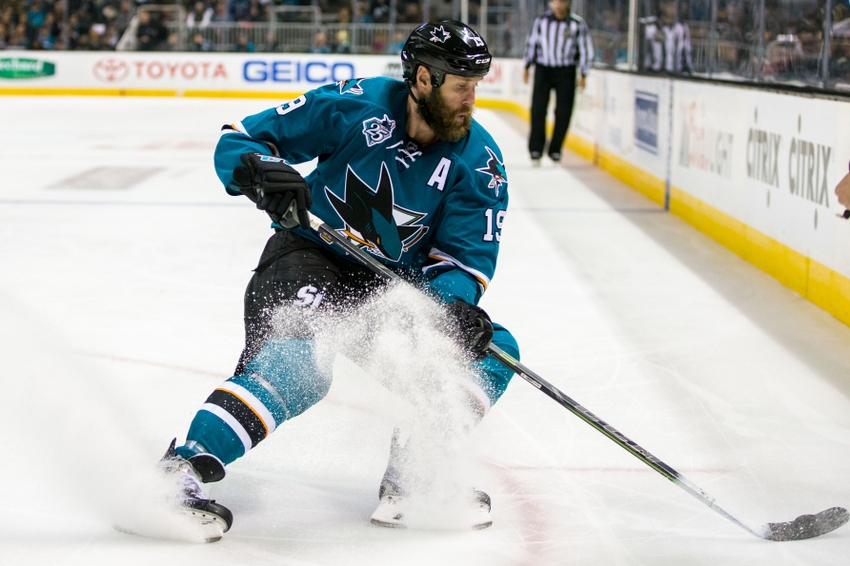 Present and past captains, Joe Thornton, Joe
Pavelski, and Patrick Marleau have all cemented their place as some of
the greatest to ever play for the Sharks and the league as a whole. Joe
Thorton is most likely a future hall of famer and is still a major cog
in the Sharks' immediate successes. Joe Pavelski, the newest captain
is right in the midst of his prime taking more and more of the weight of
this team to win the Stanley Cup in his shoulders. Lastly, there's
Patrick Marleau who inexplicably seems to fly under the radar when it
comes to any discussions of great players in the league and great
overall careers. The San Jose Sharks is the only team Marleau knows.
He's skated for them since the beginning of his career in 1997 and has
produced throughout. Others to mention on this 5-10 year run include
the likes of forward Jonathan Cheechoo, goalie Antii Niemi, forward turned defenseman Brent Burns and
defenseman Marc-Edouard Vlasic. There are of course many more who have
had a hand in the enormous success of the Sharks in the past decade.
Present and past captains, Joe Thornton, Joe
Pavelski, and Patrick Marleau have all cemented their place as some of
the greatest to ever play for the Sharks and the league as a whole. Joe
Thorton is most likely a future hall of famer and is still a major cog
in the Sharks' immediate successes. Joe Pavelski, the newest captain
is right in the midst of his prime taking more and more of the weight of
this team to win the Stanley Cup in his shoulders. Lastly, there's
Patrick Marleau who inexplicably seems to fly under the radar when it
comes to any discussions of great players in the league and great
overall careers. The San Jose Sharks is the only team Marleau knows.
He's skated for them since the beginning of his career in 1997 and has
produced throughout. Others to mention on this 5-10 year run include
the likes of forward Jonathan Cheechoo, goalie Antii Niemi, forward turned defenseman Brent Burns and
defenseman Marc-Edouard Vlasic. There are of course many more who have
had a hand in the enormous success of the Sharks in the past decade.
Like
the southern California based teams, the Sharks wallow in the shadows
of other franchises in their region, many of them wildly successful in
recent years. The Sharks have won just as much if not more than teams
such as the San Francisco Giants and Golden State Warriors, but the
difference lies in championships. The Giants have an alternate year
dynasty going, while the Warriors are only putting out one of the best
team performances of all time. The Sharks have the potential to be in
the same conversation as those two right now, but they need to start
winning Stanley Cups.
How to calculate success in the NHL
The
NHL works a little bit differently than other sports. Teams are
awarded points. The current system gives two points for a win and one
point for a loss in overtime. The success rate for teams are there for
not calculated into winning percentages, but into points percentages,
which when analyzing a teams success rate, acts very similarly to
winning percentage.
points % = points / total possible points
| Past 5 Seasons ('11'-'12 - '15-'16) | ||||
| Rank | Team | Total Points | Total Points % | |
| 1 | St. Louis Blues | 496 | 0.660 | |
| 2 | Chicago Blackhawks | 490 | 0.652 | |
| 3 | Pittsburgh Penguins | 485 | 0.645 | |
| 4 | New York Rangers | 475 | 0.632 | |
| 5 | Anaheim Ducks | 474 | 0.630 | |
| 6 | Boston Bruins | 470 | 0.625 | |
| 7 | Washington Capitals | 460 | 0.612 | |
| 8 | San Jose Sharks | 451 | 0.600 | |
| 9 | Los Angeles Kings | 451 | 0.600 | |
| 10 | Detroit Red Wings | 444 | 0.59 | |
| 11 | Montreal Canadiens | 433 | 0.576 | |
| 12 | Nashille Predators | 433 | 0.576 | |
| 13 | Tampa Bay Lightning | 430 | 0.572 | |
| 14 | Dallas Stars | 429 | 0.570 | |
| 15 | Vancouver Canucks | 429 | 0.570 | |
| 16 | Philadelphia Flyers | 426 | 0.566 | |
| 17 | Minnesota Wild | 421 | 0.560 | |
| 18 | Ottawa Senators | 420 | 0.559 | |
| 19 | New York Islanders | 414 | 0.551 | |
| 20 | Colorado Avalanche | 411 | 0.547 | |
| 21 | New Jersey Devils | 400 | 0.532 | |
| 22 | Winnipeg Jets | 396 | 0.527 | |
| 23 | Florida Panthers | 390 | 0.519 | |
| 24 | Calgary Flames | 383 | 0.509 | |
| 25 | Columbus Blue Jackets | 378 | 0.503 | |
| 26 | Arizona Coyotes | 371 | 0.493 | |
| 27 | Carolina Hurricanes | 364 | 0.484 | |
| 28 | Toronto Maple Leafs | 358 | 0.476 | |
| 29 | Buffalo Sabres | 324 | 0.431 | |
| 30 | Edmonton Oilers | 318 | 0.423 |
| Past 10 Seasons ('06-'07 - '15-'16) | ||||
| Rank | Team | Total Points | Total Points % | |
| 1 | Pittsburgh Penguins | 1004 | 0.639 | |
| 2 | San Jose Sharks | 1001 | 0.637 | |
| 3 | Detroit Red Wings | 990 | 0.630 | |
| 4 | Anaheim Ducks | 965 | 0.614 | |
| 5 | Chicago Blackhawks | 962 | 0.612 | |
| 6 | Washington Capitals | 960 | 0.611 | |
| 7 | Boston Bruins | 950 | 0.604 | |
| 8 | Vancouver Canucks | 942 | 0.599 | |
| 9 | New York Rangers | 941 | 0.599 | |
| 10 | Colorado Avalanche | 928 | 0.590 | |
| 11 | St. Louis Blues | 925 | 0.588 | |
| 12 | Nashville Predators | 921 | 0.586 | |
| 13 | Montreal Canadiens | 904 | 0.575 | |
| 14 | Dallas Stars | 899 | 0.572 | |
| 15 | New Jersey Devils | 896 | 0.570 | |
| 16 | Minnesota Wild | 882 | 0.561 | |
| 17 | Ottawa Senators | 870 | 0.553 | |
| 18 | Philadelphia Flyers | 870 | 0.553 | |
| 19 | Los Angeles Kings | 868 | 0.552 | |
| 20 | Calgary Flames | 855 | 0.544 | |
| 21 | Tampa Bay Lighting | 843 | 0.536 | |
| 22 | Buffalo Sabres | 814 | 0.518 | |
| 23 | Carolina Hurricanes | 812 | 0.517 | |
| 24 | Winnipeg Jets/Atlanta Thrashers | 808 | 0.514 | |
| 25 | Arizona Coyotes | 806 | 0.513 | |
| 26 | Florida Panthers | 803 | 0.511 | |
| 27 | New York Islanders | 798 | 0.508 | |
| 28 | Columbus Blue Jackets | 783 | 0.498 | |
| 29 | Toronto Maple Leafs | 772 | 0.491 | |
| 30 | Edmonton Oilers | 686 | 0.436 |
Sources:
<www.hockey-reference.
<www.espn.com>
<www.nhl.com>
Image sources:
California Beach: <http://www.wyndhamsantamonicapier.com/resourcefiles/mainimages/venice-beach-at-santa-monica-top.jpg>
Kings Logo: <http://lakingsinsider.com/2013-redesign/wp-content/themes/la-kings-insider/img/logo-la-kings.png>
Dustin Brown Cup: <http://l3.yimg.com/bt/api/res/1.2/Rel5kmdYDS2ms2QOkFV9IA--/YXBwaWQ9eW5ld3NfbGVnbztxPTg1O3c9NjMw/http://media.zenfs.com/en/blogs/sptusnhlexperts/AP120611119674.jpg>
Ducks Logo: <https://upload.wikimedia.org/wikipedia/en/thumb/7/72/Anaheim_Ducks.svg/1280px-Anaheim_Ducks.svg.png>
Getzlaf and Perry: <http://espn.go.com/photo/2011/0410/nhl_u_getperts_576.jpg>
Sharks Logo: <https://upload.wikimedia.org/wikipedia/en/3/37/SanJoseSharksLogo.svg>
Joe Thornton: <http://cdn.fansided.com/wp-content/blogs.dir/229/files/2016/02/joe-thornton-nhl-colorado-avalanche-san-jose-sharks.jpg>